

|
Our proprietary Fan Value Score metric was inspired by the Plus/Minus hockey statistic which measures the performance of a team broken down by individual player contribution. For example, a player with a +1 rating over the course of the Stanley Cup Finals will have been on the ice when his team has outscored the opposition by 1 goal. Conversely, a player with a -2 rating will have been on the ice while his team was outscored by 2 goals.
Similarly, our Fan Value Score assigns a value to each customer's experience. Scores above 0 indicate a customer who is likely to have a positive impact on future business (repeat customer, recommendation, positive feedback on the review sites). The higher the Fan Value Score, the more likely that customer will have a positive impact on your business, going forward. Marketing opportunities abound to target offers based on individual scores. From a wider perspective, the average Fan Value Score of a business is a great metric to track over time for monitoring loyalty trends.
0 Comments
The Rating Percentage Index (RPI) is a metric used by the NCAA basketball committee to help select teams for the tournament. With bracket-mania now in full swing, we thought it would be interesting to see how we might use the RPI to help fill out our bracket. Assumptions: Higher seeds are expected to beat lower seeds. Upsets are expected in the tournament; lower seeds beating higher seeds. Our Bracket Filling Rules/Methodology:
Upsets Expected Based on Previous 3 Tournaments: Round of 64=9 Round of 32=4 Round of 16=3 Round of 8=2 Final 4=0 Championship Game=0 So here is the bracket- we'll grade our accuracy after the tournament. Enjoy! 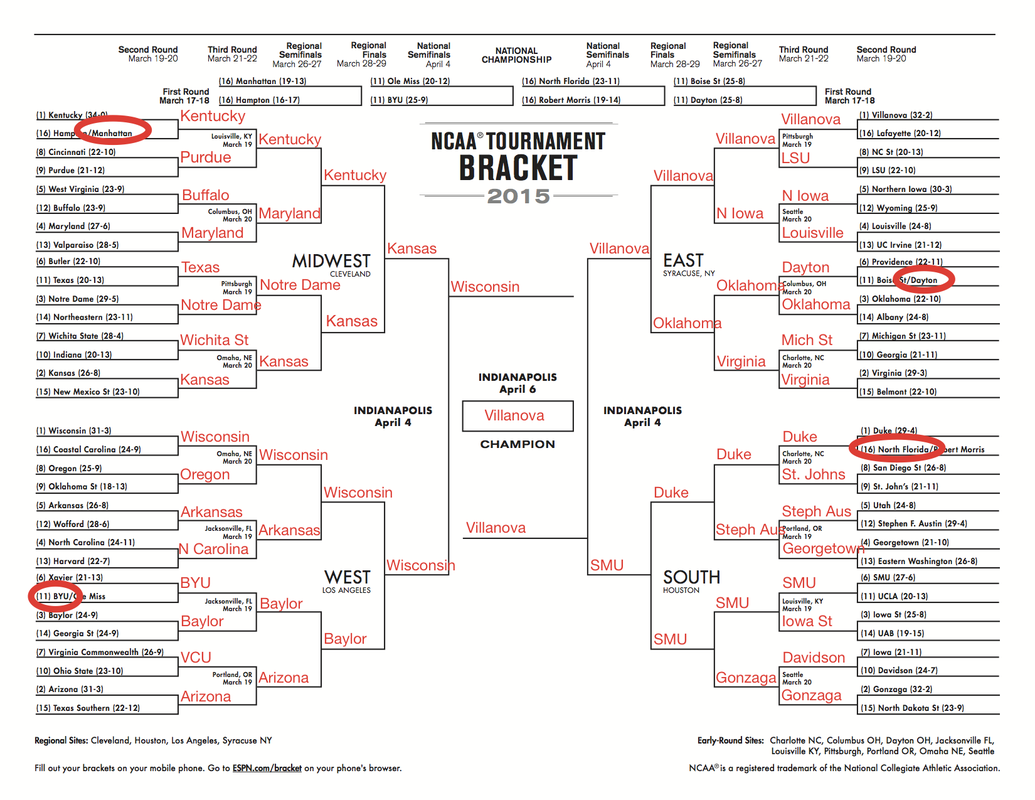
|
The blog of Database Sciences and its CX platform, GuestInsight

Archives
June 2022
Categories |
 RSS Feed